The latest global trends from Garmin cyclists

June 3, 2026
Whether you’re a competitive cyclist with a need for speed or a casual rider ready for a more challenging course, we have global insights that can help you beat yesterday.
At Garmin, we know cyclists. We know how much you love getting the miles in on your bike. That’s because we love it too. All our cycling products — including Edge® bike computers, Rally™ power meter pedals, bike radars and lights, and more — are purpose-built to help you make the most out of your rides.
We also know how much you love the data you get when you ride with Garmin. That’s why we looked at data from Garmin cyclists riding with an Edge bike computer all over the world to find the latest trends.
Here are a few highlights:
- On average, cyclists tended to spend the equivalent of a full-length feature film on their rides.
- Garmin cyclists in Italy rode the farthest per ride on average, followed by those in Belgium and Spain.
- This age group climbed nearly the elevation of the Empire State Building on average per ride — and it might not be one you’d expect.
- The more miles ridden, the higher a cyclist’s average VO2 max and functional threshold power (FTP) tended to be.
How far did Garmin cyclists ride?
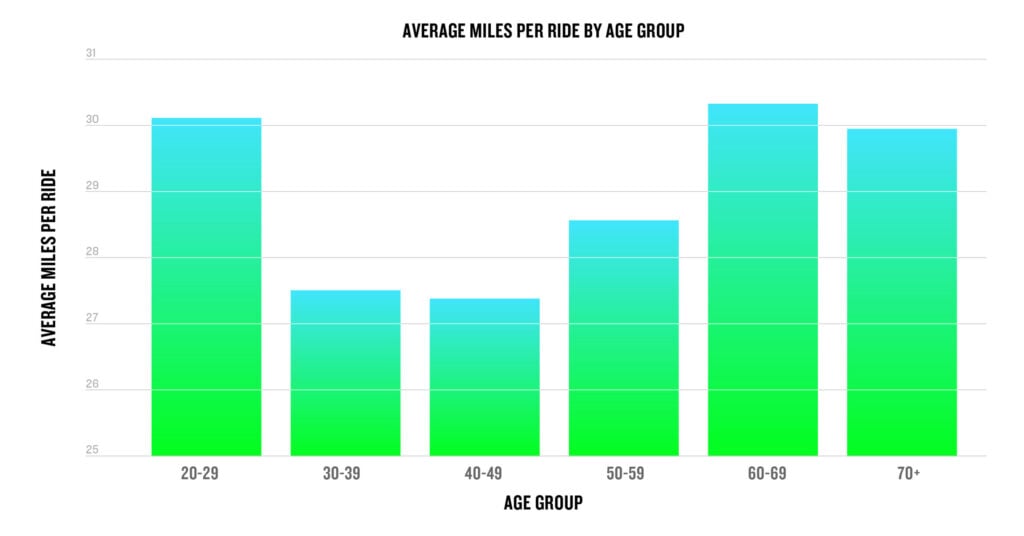
The sweet spot lies at an average of 28.59 miles per ride.
Age also played a role in how many miles users were able to squeeze in. Those ages 20–29 and 60–69 both rode just over 30 miles per ride, while those ages 30–39 and 40–49 rode just over 27 miles per ride on average.
These three locales went the distance and clocked the highest average miles per ride:
- Italy: 34.73 average miles per ride
- Belgium: 33.05 average miles per ride
- Spain: 32.80 average miles per ride
No matter how many miles you’re putting in — and whether you’re wanting to enjoy the ride or you’re looking for premium features — an Edge cycling computer can improve your time on the bike. If you need help choosing, not to worry: We can help.
Which locales are riding more?
When you ride with Garmin, you want to get out there more. We understand.
These were the top locales with the largest increases in number of cycling activities in 2025 compared to 2024:
- Belgium: 3.5%
- Luxembourg: 2%
- Taiwan: 1.7%
For cyclists getting out on the road more, awareness and visibility are critical. That’s where our Varia rearview radars and smart lights come in. The Varia™ Vue headlight camera, for example, records video in 4K (requires memory card; not included1) and saves footage automatically if it detects an incident2, while a headlight with up to 600 lumens lights your way. And Varia RearVue 820 features a powerful and precise radar that provides reliable alerts, a tail light with up to 1.24 miles of visibility and advanced vehicle tracking.
How long did cyclists spend on each ride — and when did they go?
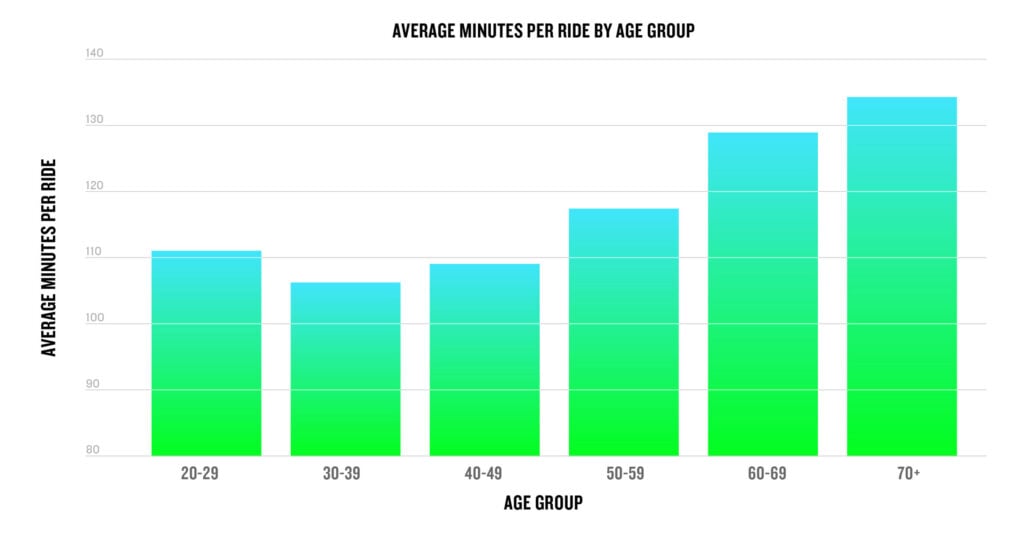
Garmin cyclists spent about 115 minutes on average on each ride. Older cyclists tended to ride longer than younger cyclists. While those ages 20–29 spent about 111.6 minutes per ride and those over age 70 spend about 134.2 minutes on average.
Cyclists in the below locales spent quite a bit more time than others on their bikes:
- Italy: 142.7 average minutes per ride
- Spain: 134.4 average minutes per ride
- Colombia: 130.3 average minutes per ride
As for the time of day, Garmin cyclists tended to kick off their rides in the early to mid-morning and late afternoon.
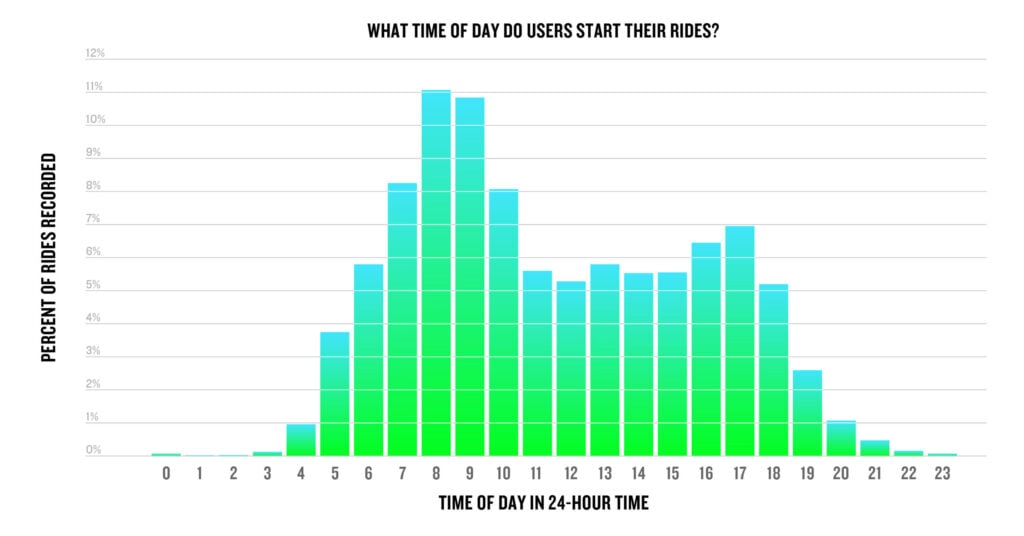
Garmin Edge cyclists also recorded most of their rides on Sundays. And the most popular month of the year for all rides was August.
No matter when you choose to go, when you’re putting in that much time on each ride, the last thing you want to worry about is battery life. Edge 1050, for example, delivers up to 20 hours of battery life per day even in the most demanding use cases on a bright and vivid display, while Edge 1040 Solar offers up to 35 hours in demanding use cases and solar charging to extend that time even more — so you can ride longer and explore further.
How fast were cyclists riding?
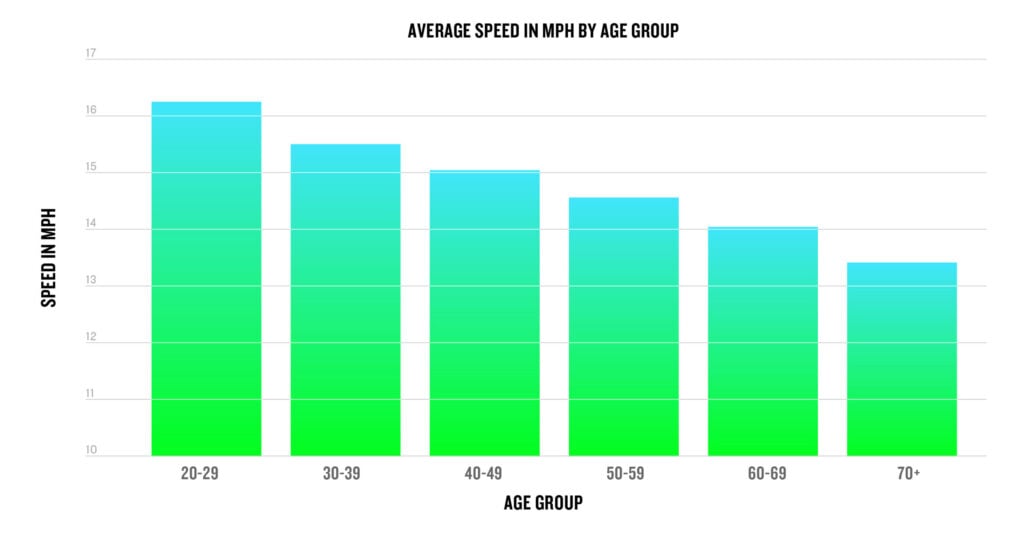
Garmin cyclists rode an average speed of 14.89 mph.
When looking at age, we found younger cyclists typically rode at a faster pace than older cyclists.
These three locales recorded the fastest speeds globally:
- United Arab Emirates: 17.75 mph
- Thailand: 16.81 mph
- Malaysia: 16.73 mph
What was the elevation of these rides?
Garmin cyclists recorded a global average elevation gain per ride of 1,158 feet per ride.
And while those ages 20–29 may have been riding the fastest, they weren’t climbing the most. That honor falls to those ages 60–69, with an average elevation gain of 1,201 feet per ride — nearly the equivalent height of the Empire State Building in New York City.

These three locales recorded the highest average elevation per ride:
- Spain: 1,704 average feet
- Colombia: 1,678…