New data shows how Garmin runners hit their stride

June 3, 2026
If you run with a Garmin smartwatch, you probably spend a few minutes (OK, more than just a few) looking at your performance data when you get home from a run. How far did you run? What was your pace? And if you’ve been running for a while, you’re probably peeking at that VO2 max number too. You get all that and so much more when you run with Garmin.
But where does your data fit in with users across the globe? We can help you figure that out. We looked at Garmin Connect™ app data from runners — all over the world — to find trends.
Here are a few highlights:
- The average run distance for all users was about 4.8 miles, but the age group logging the longest average run might surprise you.
- European locales clocked the fastest average pace, with Ireland leading the way at a 9:09 minutes per mile pace.
- Garmin runners are all committed to beating yesterday. Runners under 40 saw the biggest upticks in running activities, and athletes over 60 made big strides as well.
- Strength training is gaining traction: We found a nearly 25% increase in users who recorded a run and a strength activity in the same week.
- The average VO2 max for all Garmin runners was 50.
- Garmin runners tended to record a better sleep score compared to non-runners. Plus, the average resting heart rate1 of Garmin runners decreased as they ran farther.
How many miles do Garmin users run?
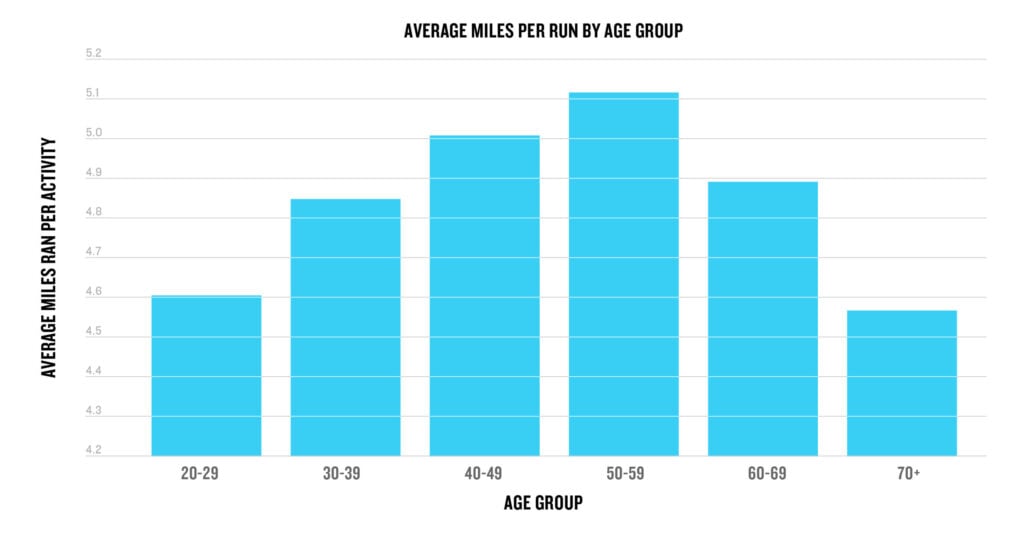
The average distance on a run for all users was 4.82 miles. Those ages 50–59 ran slightly more per activity on average at 5.1 miles. Those ages 20–29 tended to run slightly less at 4.6 miles per run.
No matter how many miles you’re putting in, it’s important to pay attention to how your body restores itself. That’s where your recovery time, powered by the Garmin Human Performance Lab, comes in. This feature provides scientifically personalized insight into how long it will be before you are fully recovered so you know when you’ll be ready to gain the maximum benefit from your next hard workout.
What month and day of the week were the most popular?
August was the month of the year with the most miles run. Garmin users recorded the most miles on Saturdays — we love a Saturday long run too.
If you’re venturing out on a long run, you don’t have to worry about battery life when you run with Garmin. Our long battery life — and we mean long — means you should get up to 1 week of battery life in smartwatch mode at a minimum on most outdoor and fitness watches, or even up to 90 days of battery life in smartwatch mode with solar charging2 on the Enduro™ 3 GPS endurance smartwatch.
How many miles did users run each week?
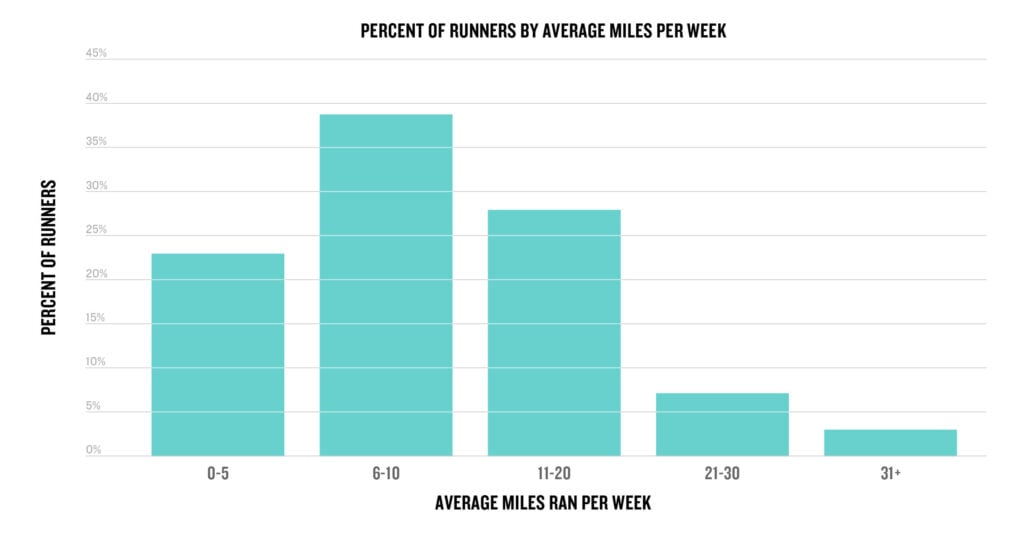
Now, how much did Garmin users run in a week? The sweet spot is between 6–10 miles per week on average with nearly 40% of runners falling in that category, while 28% of runners hit their stride between 11–20 miles per week. Only 7% of users ran between 21–30 miles a week and just 3% ran more than 31 miles each week.
Compatible Garmin smartwatches can help you manage the impact of running on your body with the running tolerance feature. Powered by the Garmin Human Performance Lab, this feature offers the insight you need to manage that impact while you build and maintain mileage.
How long does it take to run a mile?
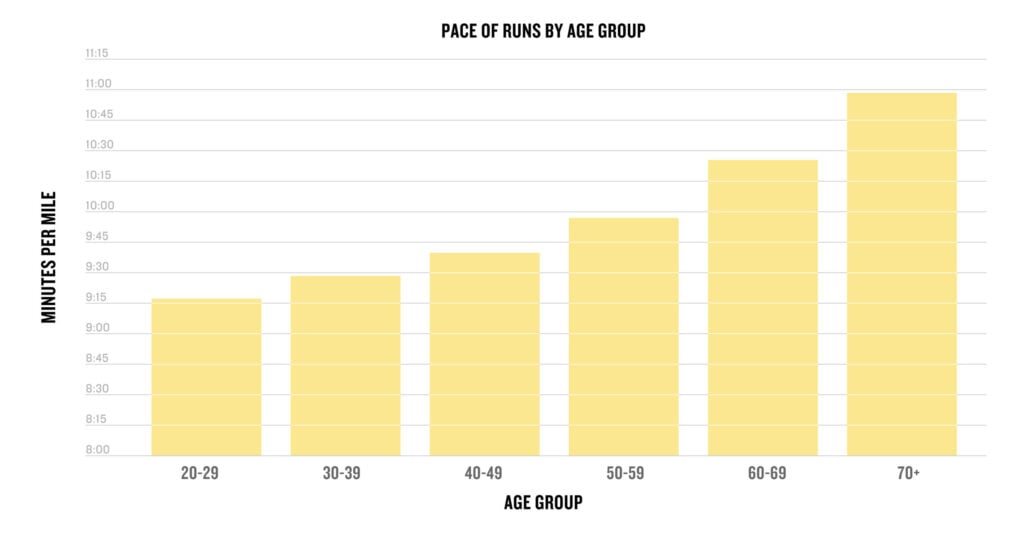
The average pace per mile was 9:21 for men and 10:11 for women. As you might expect, the younger age groups ran a bit faster than the older ones, with an average speed of 9:16 per mile for those 20-29 compared to 10:57 per mile for those over 70.
These locales ran the fastest on average:
- Ireland (9:09 minutes per mile)
- Portugal (9:12 minutes per mile)
- Italy (9:13 minutes per mile)
If you’re wondering just how efficient you are while clocking those miles, check the running economy feature on a compatible Garmin smartwatch, such as Forerunner® 970. This uses your long-term running volume, stride length and step speed loss to measure your overall energy efficiency — when paired with the HRM 600 monitor.
How much time do Garmin users spend running?
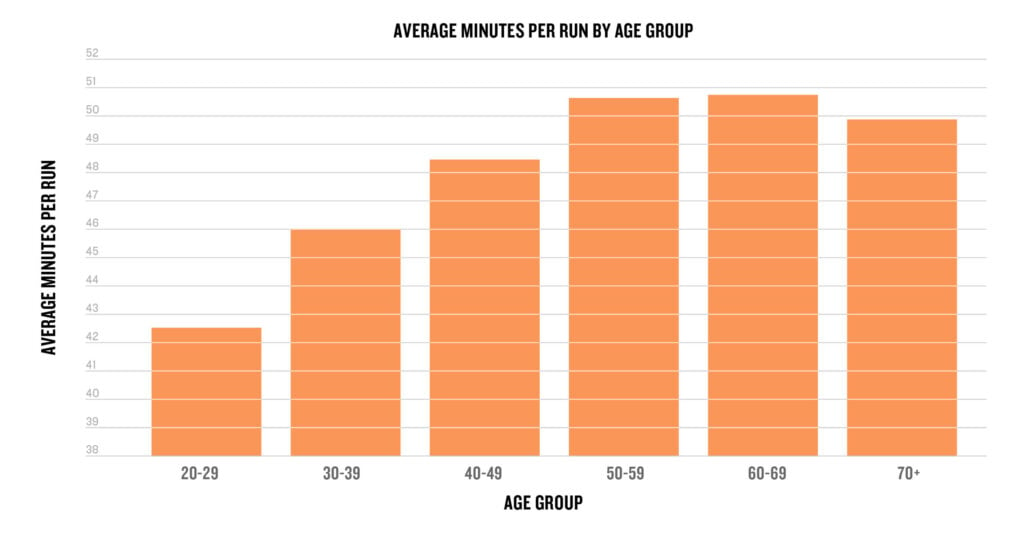
On average, Garmin users spent 46.3 minutes on a run. When broken down by age, those ages 60–69 ran 50.8 minutes, 50–59 ran 50.7 minutes, over 70+ ran 49.9 minutes, 40–49 ran 48.5 minutes, 30–39 ran 45.9 minutes and 20–29 ran 42.6 minutes.
To power your long training sessions, select Garmin smartwatches are packed with features for the elite runner. Determine how hard you can push yourself on a run by looking at your real-time stamina that tracks and manages your exertion, while your endurance score helps track your progress after workouts as you strive to become a better endurance athlete. Plus, with dynamic round-trip routing, you can tell your watch how far you want to go and it will suggest return routes.
How much more are Garmin users running?
The number of running…