Why OPUS Projects’ hub processing strategy is not a radial survey
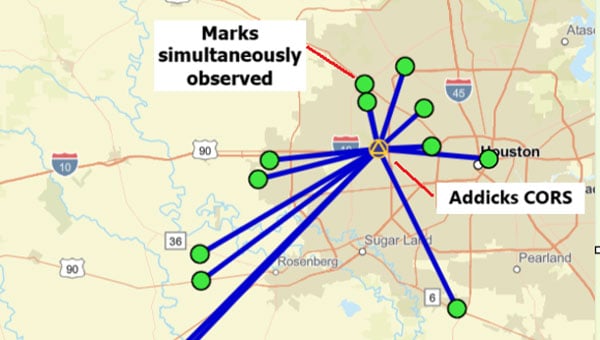 Photo:Plot of OPUS Projects network diagram. Hub is Addicks CORS, all marks are simultaneously observed during the session. (Photo: Dave Zilkoski)
 On Jan. 16, 2025, as part of the OPUS User Forum, the National Geodetic Survey (NGS) Northeast Regional Geodetic Advisor, Dan Martin, gave a webinar titled “Why OPUS Projects’ Hub Processing Strategy is not a Radial Survey.” The presentation can be downloaded here.
First, let’s define a GNSS radial survey.
A “GNSS radial survey” is a surveying technique where a central control mark is established within an area, and vectors are measured from the central control mark to various other marks of interest surrounding the central control mark, essentially creating a “spoke-like” network design.
Why not use a GNSS radial survey when establishing geodetic control networks?
Basically, you cannot directly calculate a “relative accuracy” between two marks if no observations are taken between them. That said, a direct measurement such as a GNSS vector allows error propagation between two marks. Therefore, using the “spoke-like” concept, you know the relative accuracy between the central control mark and a single mark at the end of a single spoke. Still, you don’t know the relative accuracy between marks on the different spokes.
Anyone who has used OPUS Projects or seen presentations on OPUS would think, based on the OPUS Project’s HUB processing strategy, that OPUS Projects was performing a radial survey.
When using OPUS Projects, NGS recommends that users select one CORS as a HUB while processing GNSS session data. In the example here, the Addicks CORS (ADKS) was used as the HUB in data processing. So, why is this not considered a radial survey? It may look like a GNSS radial survey but there’s a lot that goes on behind the scenes.
The bottom line is that OPUS Projects is denoted as a simultaneous (session) processor. This means the vector solution is computed from simultaneous processing of all independent vectors with mathematical correlations between all simultaneously observed vectors. OPUS Projects processing includes all independent vectors along with mathematical correlations to provide the relative connection to marks that are simultaneously observed. In the example above, when processed by OPUS Projects, all the marks occupied (indicated by the lines connecting to the Addicks CORS HUB) will have correlations computed between each other. These correlations are included in the data that is used in the least squares adjustments that are performed during the OPUS Projects workflow (NGS uses a file denoted as the gfile to document the correlations.)
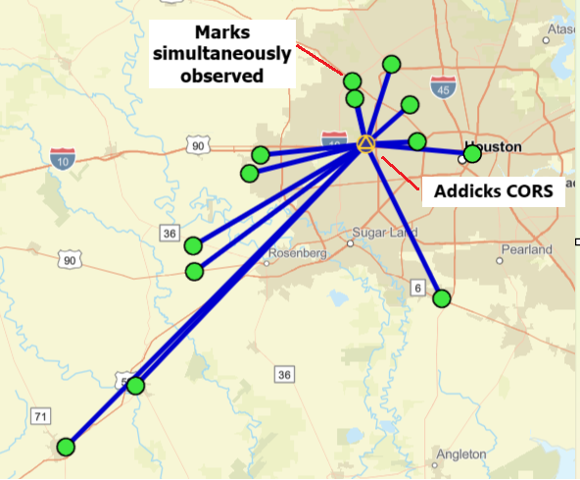
The image below provides a sample of mathematical correlations between marks simultaneously observed during the session. The gfile can be a large file when the survey includes a lot of simultaneously observed marks because there will be correlations between all marks. There were 13 marks simultaneously observed during the sample session, so the “spoke-like” diagram includes imaginary lines between every mark because of the mathematical correlations between these marks.
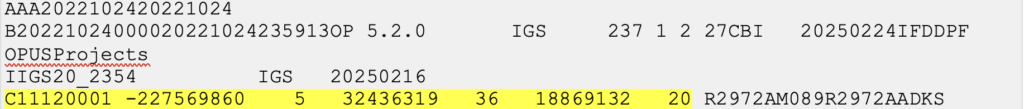
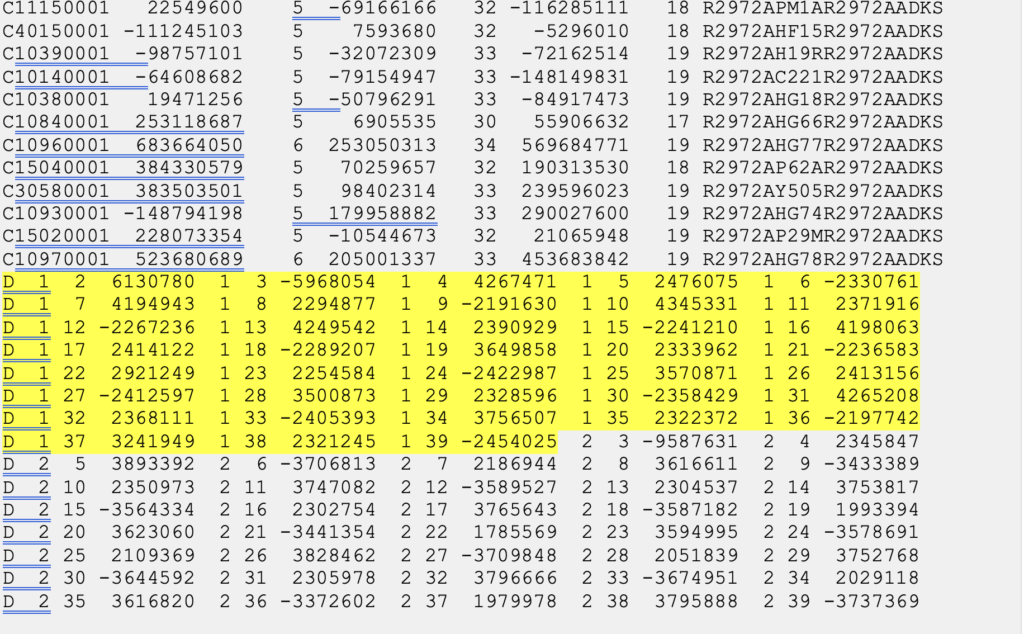
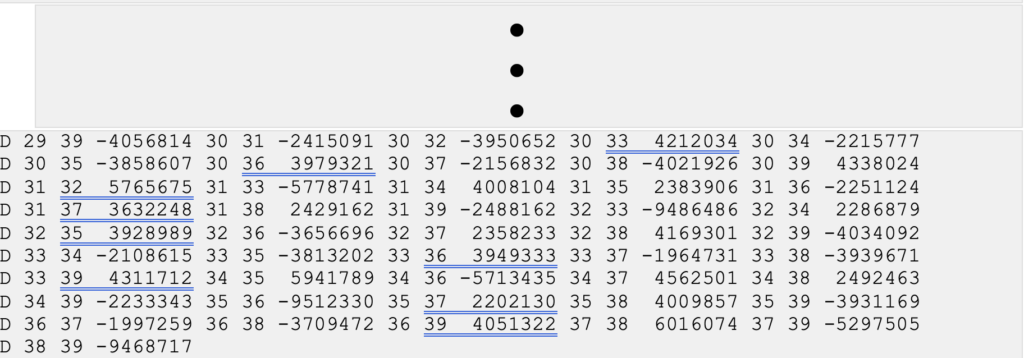
(Gfile contains baseline information with mathematical correlations.)
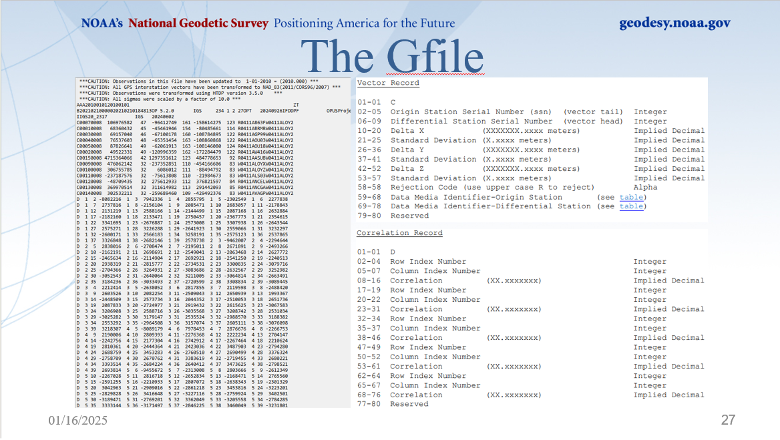
Dan’s presentation included a slide that described the file’s format. The file provides information on the vectors (delta X, delta Y, delta Z and their standard deviations) between the HUB and the individual marks, plus the mathematical correlations between all marks simultaneously observed during the session. I have highlighted a vector’s components and standard deviations and a set of mathematical correlations.
The image below, from Dan’s presentations, describes the format of NGS’s gfile.
Some software programs perform what is called sequential (baseline) processing, which involves processing one vector at a time and ignoring the mathematical correlation between baselines observed in the same session. So, what does this mean, and why is it important?
A couple of definitions are necessary to understand the concept. Independent baselines are baselines where no other baseline is a linear combination of another baseline. Linearly dependent (trivial) baselines are baselines that are linear combinations of another baseline. Basically, once you have used a particular set of data to compute a vector, you can’t use the same data to compute a different vector.
Dan did a nice job during his webinar explaining what baselines are considered trivial and what baselines are non-trivial. This is very important because if your software is a sequential (baseline) processor, you must ensure that trivial vectors are not…