Mapping rights-of-way subject of July 13 virtual conference

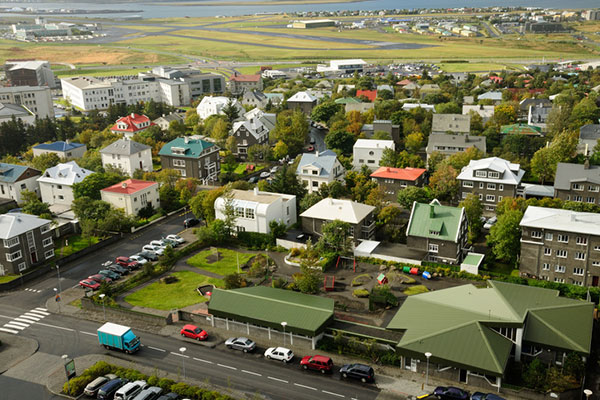
Photo: Jordanlye/iStock/Getty Images Plu/Getty Images
The 2021 Right-of-Way Asset Mapping Exchange is an interactive online Virtual Conference Experience focusing on innovation in asset inventory and mapping that supports all phases of infrastructure lifecycles. It takes place July 13 and is free of charge.
The event provides hands-on actionable information on a variety of current and emerging technologies. Via presentations, discussions and one-on-one meetings, the event gives those who attend an opportunity to learn from and engage with technology and experts in a wide range of disciplines, and some of their key clients, as well as peers and colleagues.
Moderator of the event is Matteo Luccio, GPS World editor in chief. Speakers include:
- Bradford Folta, GIS architect and CEO, Honey Badger Analytics LLC
- Larry Fox, VP Marketing and Business Development, Bad Elf LLC
- Shawn Melamed, product marketing manager, Catalyst
- Bill Singleton, vice president, Ecopia AI
- Brian L. Soliday, chief revenue officer, VoxelMaps
Why ROW Asset Mapping?
Right-of-way (ROW) corridors, especially in urban areas, are densely populated by many public and private infrastructure features — overhead electric and telephone wires, street-level parking meters, signage, traffic sensors, underground fiber-optic cables, water mains, natural gas pipes and sewers. They are constantly changing environments, as additional poles, signs and conduits are installed and old ones are replaced with newer ones to restore service after storm damage.
Yet public works and utility managers, engineers and planners need to know what each stretch of each ROW corridor contains at any given moment, especially as they work to make our cities “smarter.” Hence, the Sisyphean task of mapping these assets.
Fortunately, the technology to map ROW assets is rapidly improving. Platforms for data collection include vehicles driving at normal traffic speeds, UAVs and manned aircraft. Sensors include digital cameras, lidar scanners and ground-penetrating radar.
Visualization tools include augmented reality, virtual reality, mixed reality and models ranging from small 2D and 3D ones of individual features up to digital twins of buildings and, eventually, entire cities. Increasingly, the tedious work of identifying and classifying features is being delegated to automated feature extraction software, a form of artificial intelligence.
The conference will discuss
- Comparing 2D and 3D visualization tools.
- Explaining the benefits of 3D models as an advanced spatial analysis tool for urban planning.
- Exploring the future of smart cities and digital twins.
- A light equity study and pole inventory in the context of the transition to LED lighting.
- How a two-man team can capture 500 miles worth of utility data in two weeks.
Registration is free.
