Charting uncharted waters: Bathymetry in action
For centuries before sonar, lidar and unmanned surface vehicles (USVs), sailors would measure depths by throwing a line overboard with a lead weight at the end — called a leadline — and record its length to the seafloor. Mapping large areas of the seafloor, therefore, required thousands of these measurements.
However, even after extensive measurement efforts, the acquired data was often inaccurate or incomplete, which forced navigators and surveyors to estimate the seafloor’s bathymetry until remote sensing was introduced in the 1970s.
Since then, the growing need for increasingly accurate and rapidly available data has led to a worldwide effort to develop sensors and alternative techniques for measuring depths.
In the ongoing Florida Seafloor Mapping Initiative (FSMI), the Florida Department of Environmental Protection tasked Woolpert Geospatial Program with acquiring bathymetric survey data using lidar technologies to produce a comprehensive, publicly available, high-resolution seafloor surface model of Florida’s coastal waters by 2026.
Similar initiatives across the globe have kick-started innovations in underwater data collection and interpretation. In this feature, SBG Systems, CHC Navigation (CHCNAV) and Advanced Navigation describe how they used modern hydrographic surveying to aid defense departments, produce 3D topographic maps, and analyze the depth of The Great Blue Hole in Belize.
Exploring challenging waters
SBG Systems
Advancements in hydrographic surveys can lead to the exploration of depths previously unknown. The Great Blue Hole, located off the coast of Belize, is the largest marine sinkhole in the world, with a diameter of 300 m and a depth of 125 m. This major scuba hotspot is part of the Belize Barrier Reef Reserve System and a UNESCO World Heritage Site.

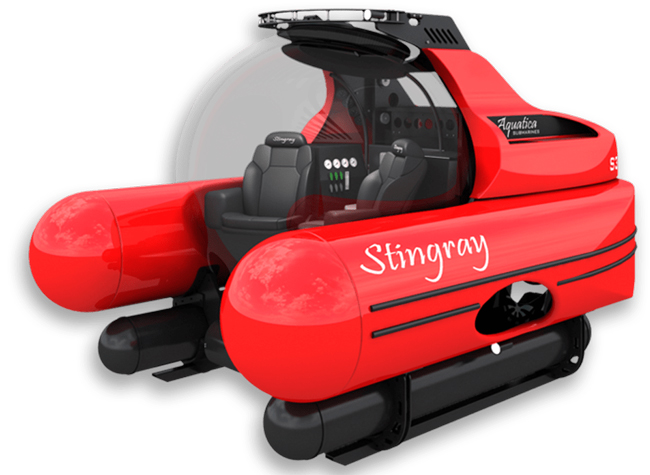
Aquatica Submarines’ Stingray 500 submarine. (Image: Aquatica Submarines)
Aquatica Submarines conducted an expedition survey of the Blue Hole. For two weeks, a team of scientists, explorers, and filmmakers collected survey data and captured photos and videos of this geological wonder. It is the first time in history that an expedition of this scale was attempted at the Blue Hole.
The challenge: Finding submersibles to equip with sonar
The expedition team chose two submarines to carry out the survey: its Stingray 500 and the Roatan Institute of Deepsea Exploration’s IDABEL. Both vessels can carry up to three persons for a maximum of 12 hours.
Norwegian technology group Kongsberg’s dual-axis sonar technology was used to create a 3D representation of the sinkhole. The surface and submarine-mounted sonar equipment were also equipped with SBG Systems’ Ellipse miniature inertial navigation system (INS).
The Ellipse was used to mark the Blue Hole perimeter and scientists then processed the recorded data using MS1000 processing software.
Additional steps and results: Analyzing 3D sonar maps
A key outcome of the expedition is the creation of a complete 3D sonar map of the Blue Hole using point-cloud data collected by Kongsberg’s dual-axis sonar to create a 3D map of the site. The sonar was pole-mounted on the survey vessel with the GPS receiver and motion reference unit directly over the scanner’s head.
Sonar expert Mark Atherton from Kongsberg’s Canadian subsidiary, Kongsberg Mesotech, was a key member of the science-based sonar and data collection team. Atherton operated the sonars aboard the Research Vessel Brooks McCall, contributing to an invaluable high-resolution map of the entire sinkhole.
“By understanding the geological history and geometric structure at the Blue Hole, we can contribute new data to the global scientific community studying sinkholes and cenotes,” Atherton said.
The team was able to conduct more than 20 dives into the large sinkhole, taking videos and 3D images during each trip. They also completed a two-hour live broadcast featured on The Discovery Channel.
“What [the Great Blue Hole] tells us is that sea level rise is not [always] a gradual process,” said Erika Bergman, Aquatica’s chief pilot and oceanographer. “We carefully measured the terraces and layers built up in the hole and we can see that sea level rise can happen dramatically.”
Producing 3D hydrodynamic models
CHC Navigation
Flood control structures — such as dikes, dams, spurs, drainage channels, and floodways — are designed to protect coastal and riverine areas of cities and farms and, above all, the people who live there.
To prevent flooding in low-lying regions and support national ecological protection and development strategies in the Yellow River Basin in China, the Ministry of Water Resources launched the “Digital Twin Yellow River Construction Plan (2022-2025)” project. The Chinese Bureau of Hydrology and Water Resources was tasked with building a digital twin flood model based on part of the country’s Yellow River, targeting the 28-km section of the river basin.
The challenge: Building and…
