2025 Garmin Connect data report

December 3, 2025
It’s time to look back at your health and fitness trends for 2025. How did you do?
It’s no secret Garmin users love their data. After all, that’s why you wear Garmin smartwatches to begin with. Every year, we unpack that data to provide a comprehensive look at just how active and wellness-focused you were.
This data comes from tens of millions of Garmin watches worn all over the world. And with more than 100 built-in activity apps — plus a wealth of health and wellness insights — we’ve got some pretty compelling knowledge to drop.
Who stressed less — men or women? What locale dominated average step counts? Is Vietnam really serving a big advantage when it comes to racket sports? Thanks to the Garmin Connect™ app — and our extensive community of users — we have all the answers. But first, a few key takeaways from our annual data deep dive:
- Garmin users are getting more active — and they especially love strength training and racket sports. Pickleball, anyone?
- Whether Garmin users were 18 or 70 years old, each generation had one activity they loved the most. They recovered differently too.
- More than half of Garmin users recorded 8,000 or more steps a day on average. The overachievers took their step count to extremes — more than doubling that number.
- You were committed to setting your personal records — and earned unique Garmin Connect badges while you were at it.
One note before we get started: All the data below is on a per capita basis. We just thought you should know.
How active were Garmin users in 2025?
If there’s one thing we know about Garmin users, it’s that you love getting active. No matter how you move your body, you’re moving more.
Garmin Connect users performed 8% more activities in 2025 compared to 2024. The top five activities were running, walking, cycling, strength training and indoor cardio.
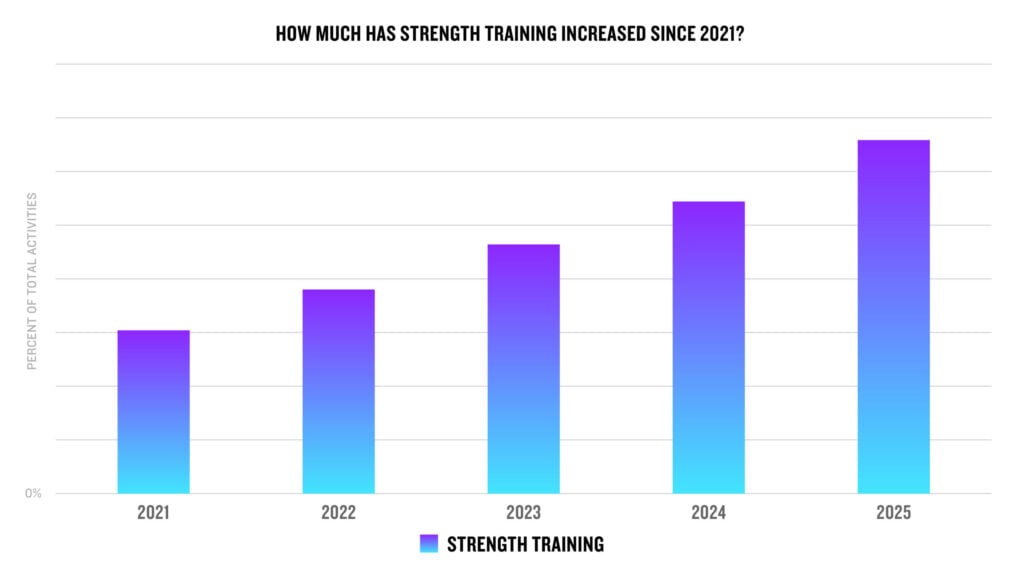
Strength training: This activity increased 29%. It’s the fourth year in a row that strength training has increased more than 20%. Plus, women did 6% more strength training than men in 2025. And we have to give a quick shout-out to the gym rats in Brazil, who did 44% more strength training activities per user than those in the next highest country, Mexico.
Running: Whether you were a new runner in 2025 or you already used our free race day features on your running smartwatch, Garmin runners showed their dedication this year. Outdoor running — with Japan leading the way — increased 6%, while indoor running was up 16%, with Norway runners taking the lead. Men went on 21% more outdoor runs than women, while women did 16% more indoor runs.
Hiking: Garmin users love hitting the trails — and showed it too, with hiking increasing 12% in 2025. Slovenia hikers had the highest rate of hiking activities by user. Might we recommend using Garmin Trails to find your next hike? We can also help you choose the best GPS watch for hiking or backpacking here.
Racket sports: Whether you played pickleball, badminton, table tennis, racquetball or another racket sport, you were part of a 67% increase. Women and 18– to 29-year-olds drove this increase, with Garmin users in Vietnam swinging the racket the most per capita.
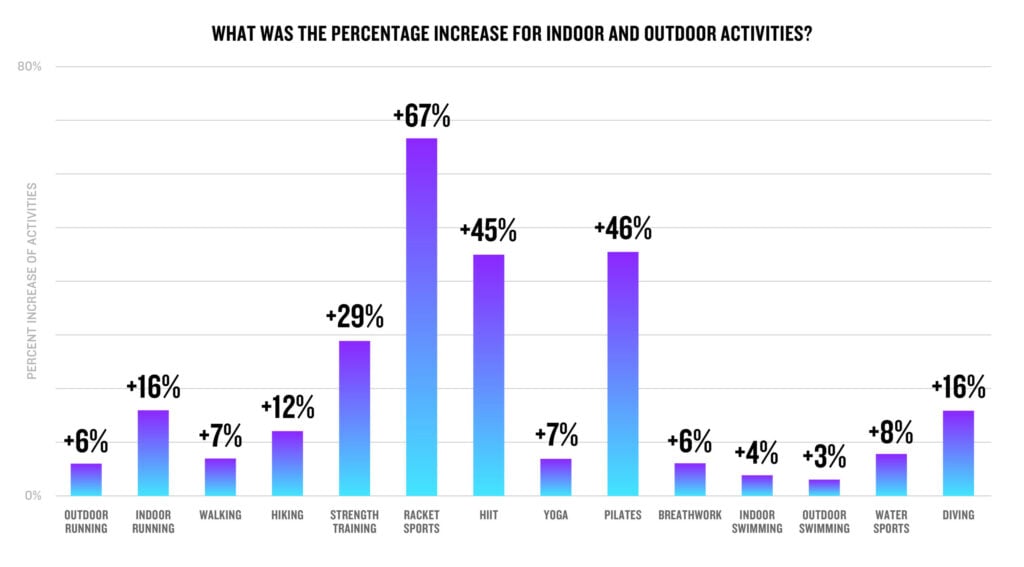
Those are just a few of the broad range of activities that you can do with Garmin. Let’s look at just how much activities have increased for indoor and outdoor activities.
After racket sports, Pilates and high-intensity interval training (HIIT) activities saw the largest increases this year. (If you need help coming up with your next HIIT workout, we can help). The number of dive activities increased 16%, while walking and yoga activities both increased 7%.
Our winter sports aficionados were hitting the slopes more too, with an increase of 8%. Garmin users were also committed to taking deep breaths, with the breathwork activity increasing 6%. Last, but not least, our aquatic friends made the most out of their swim workouts as indoor swimming increased 4% and outdoor swimming increased 3%.
How and when do Garmin users exercise?
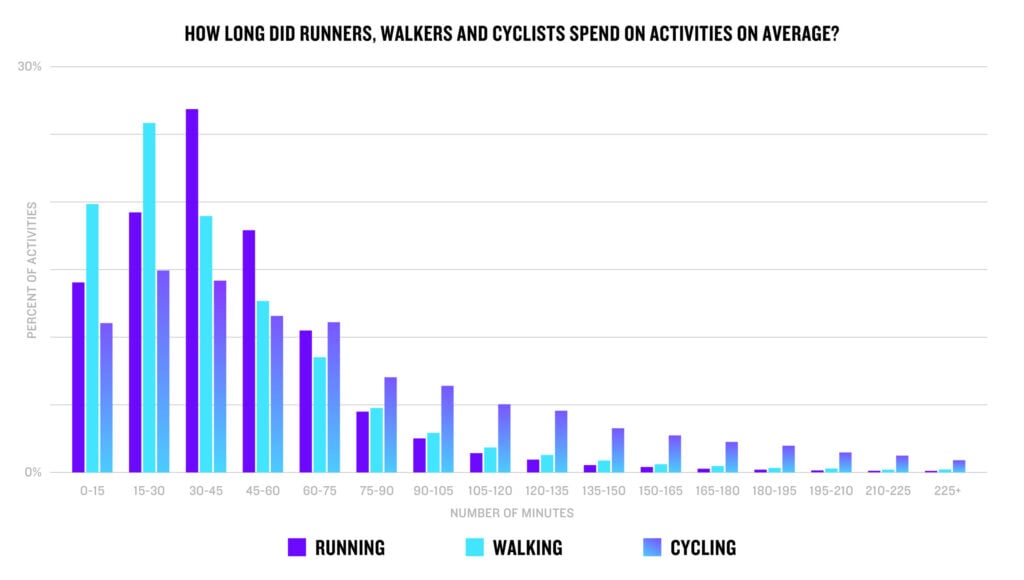
Garmin users spent about 55 minutes per activity on average.
Let’s look at running, walking and cycling. More than a quarter of runs recorded were 30-45 minutes long, while walkers tended to stick closer to 15- to 30-minute walks. Nearly half of cycling activities lasted an hour or longer — we know it takes time to stay dedicated to the pedals.
Different generations also had their preferences on just how they were getting that exercise done.
- 18–29: They did the most outdoor running and led track running.
- 30–39: This age group logged the most strength training, indoor cardio and treadmill activities.
- 40–49: They did the most trail running of any age group.
- 50–59: This age group dominated the indoor cycling, lap swimming and mountain biking categories.
- 60–69:…